
Market intelligence
Gamma, flow and volatility, next to the chain.
The numbers options desks watch, computed from licensed live data and shown in panels you dock beside your ticket.
Gamma exposure
Walls, flip and the 0DTE magnet
Net dealer gamma at every strike, with the call wall, the put wall, the flip where it changes sign and the 0DTE magnet. Switch the measure to delta, vanna or charm, or one expiry against another.
GEX by strike and as a profile, for SPX, BTC and ETH.

Profile
What happens if the market moves
The profile view shows net gamma as spot moves: where dealers turn from damping moves to chasing them.
Net dealer gamma recomputed across a range of SPX levels.

0DTE flow
Today's options, minute by minute
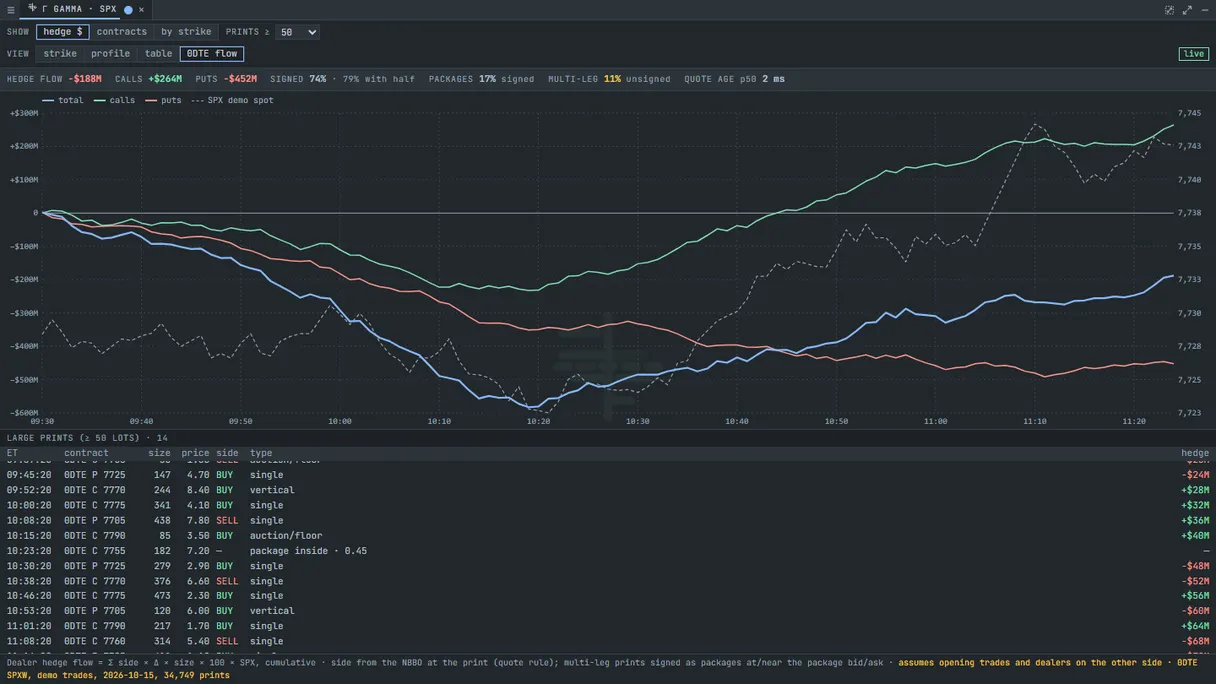
Every 0DTE SPXW print is signed buy or sell from the bid and ask when it traded, turned into the hedge it implies and summed for calls, puts and the total. Large prints are listed as they come. Multi-leg prints are grouped into their packages and signed from the package's net price; a group that cannot be resolved stays unsigned rather than guessed.
SPXW prints signed by the quote at the print, summed each minute.
Volatility
Surface, term structure and skew
The surface lays out implied volatility by expiry and by distance from spot or by delta, as a level or as the change since yesterday. The term structure shows at-the-money IV and the 25-delta risk reversal by expiry.
The expected move from the at-the-money straddle: for the next expiry in the volatility panel, for every expiry as a column in the chain, and for 0DTE, the next day, the week and the month on the price chart.
Near-the-money skew about every 30 s, the wings every 3 min.


Skew
The smile of any expiry
Pick expiries and compare their smiles side by side, by strike, with the spot marked.
Out-of-the-money strikes on a grid that widens away from spot.
